Ireland in the 1650s lay in ruins. Twelve years of calamitous warfare had destroyed the country's infrastructure and resulted in the death of over 20% of the Irish population.
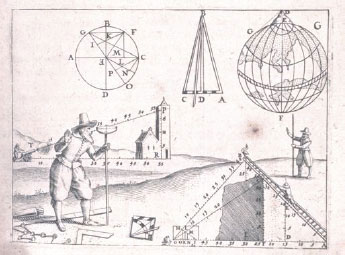
The armies of the English Commonwealth, commanded by Oliver Cromwell, emerged victorious and immediately undertook an ambitious project of social engineering, underpinned by a massive transfer in landownership from Irish Catholics to English Protestants. For this to happen, the land had to be accurately surveyed and mapped, a task overseen by the surgeon-general of the English army, William Petty.
The Down Survey of Ireland
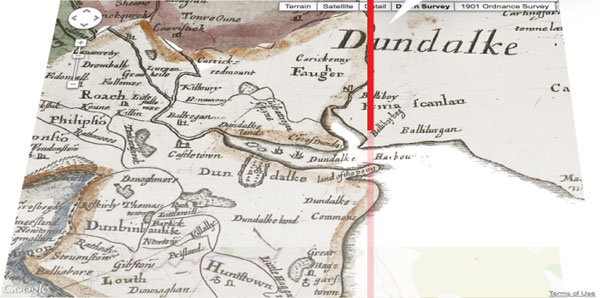
Taken in the years 1656-1658, the Down Survey of Ireland is the first ever detailed land survey on a national scale anywhere in the world. The survey sought to measure all the land to be forfeited by the Catholic Irish in order to facilitate its redistribution to Merchant Adventurers and English soldiers. Copies of these maps have survived in dozens of libraries and archives throughout Ireland and Britain, as well as in the National Library of France. This Project has brought together for the first time in over 300 years all the surviving maps, digitised them and made them available as a public online resource.

Ireland, the Mercator map of 1570 and the Down Survey map
The Down Survey Website
There are two main components to this website. The Down Survey Maps section comprises digital images of all the surviving Down Survey maps at parish, barony and county level. The written descriptions (terrier) of each barony and parish that accompanied the original maps have also been included. The second section, Historical GIS, brings together the maps and related contemporaneous sources – Books of Survey and Distribution, the 1641 Depositions, the 1659 Census – in a Geographical Information System (GIS). All these sources have been georeferenced with 19th-century Ordnance Survey maps, Google Maps and satellite imagery.

Barony Map

Down Survey Data

Down Survey County Map

Open Street Map - Map data ©OpenStreetMap and contributors

Satellite Image

Georeference Co-ordinates
A Geographic Information System (GIS) integrates hardware, software, and data for capturing, managing, analyzing, and displaying information that may be geographically referenced. GIS allows us to view visualise data in ways that reveal relationships, patterns, and trends in the form of maps or charts.


